BDA420
Welcome
Summary
Introduction
Evaluation
Jupyter Notebooks Basics
Installing/Running Jupyter Notebooks
Introduction
About Myself
Electrical Engineer by trade
+20 years of experience in Software Development
Teaching this course for the fourth time in a row!
Brazilian, Canadian, and French
Father of two little honey badgers tasmanian devils beautiful children
What we will Learn
Jupyter notebooks
Apache Spark
Databricks
Big Data analysis:
Dataframes, RDDs, etc.
GroupBy and filtering methods
Window operations and Datetime
Working with Streaming Data
Delivery Method
→ Lectures will be Flexible
→ Each lecture will be followed by a workshop
→ Blackboard will be used for assignments, for announcements, and for grading purposes
→ Course's website contains general info and slides
→ We will use databricks for data analytics
Evaluation
Assessments
8 Workshops worth 5% each (40% in total)
1 Final Project worth 30%
1 Midterm worth 15%
1 Final Exam worth 15%
Workshops
Individual work
Posted on Blackboard
Number of simple tasks that need to be solved using Jupyter Notebooks
Students must submit their Jupyter Notebooks over Blackboard
Final Project
Individual work
Comprehensive analysis of a chosen database using Spark tools
Students must present their findings
Each presentation is followed by a QA session
Midterm and Final Exam
In person, synchronous, pen-on-paper evaluations
Focused on theoretical understanding
Practical questions might also be asked
Students can be given accommodations, granted proper documentation
Course Policies
To pass this course students must:
→ Average 50% or higher across all assessments
→ Average 50% or higher across Midterm, Final Exam, and Final Project
Introduction to Jupyter Notebooks
Jupyter Notebooks
Documents that contain live code, equations, graphs and narrative text
Evolved from an interactive shell called IPython: hence the .ipynb format
Can use Python, Julia and even R
Jupyter Notebooks
Notebooks can include cells with:
Live code
Plots (Matplotlib, plotly)
Markdown Text
LaTex Mathematical Equations
Jupyter Setup
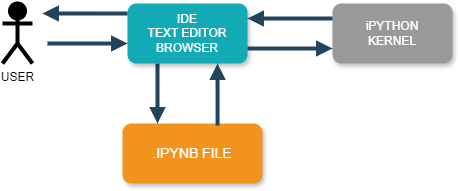
Jupyter Setup
You can run individual cells in any order
All cells share the same workspace*:
→ Access to the same variables and functions
→ Access to previously imported libraries
Installing/Running Jupyter Notebooks
Jupyter Online
You can run online notebooks at: jupyter.org/try
In this course, we will mostly run notebooks using VS Code or databricks
You can use your preferred tool!
Visual Code & Jupyter
VSCode supports Jupyter via a Python Extension
Requires Python to be installed
Some libraries might need to be installed
Suggestion: anaconda
Alternatively, you can use a docker container
Example
import pandas as pd
import matplotlib.pyplot as plt
s = pd.Series([1, 3, 5, 6, 8])
plt.plot(s)
## A Heading
Some text
A text with **bold** and *italic*
> a quote
$e = mc^{2}$Example
import plotly.express as px
import plotly.graph_objects as go
import numpy as np
x = np.linspace(0, 10, 100)
y = np.sin(x)
fig = px.line(x=x, y=y, labels={'x': 'X-axis', 'y': 'Y-axis'}, title="Basic Line Chart")
fig.show()
df = pd.DataFrame({
      'Participation': [1, 1, 1, 2, 2, 2, 3, 3, 3, 4, 4, 4, 5, 5, 5],
      'Player': ['Pele', 'Messi', 'CR7', 'Pele', 'Messi', 'CR7', 'Pele', 'Messi', 'CR7', 'Pele', 'Messi', 'CR7', 'Pele', 'Messi', 'CR7'],
      'Titles': [1, 0, 0, 2, 0, 0, 2, 0, 0, 3, 0, 0, 3, 1, 0]
  })
fig = px.bar(df, x='Player', y='Titles', color='Player', animation_frame='Participation',
               title="Worl Cups Titles")
fig.update_yaxes(range=[0, 5])
fig.show()
Reading Material
Jupyter Notebooks on VSCode (video)