BDA420
Databricks
Summary
What is Databricks
Creating an Account
User Interface
Computes
Notebooks
Importing Data
Creating Tables
Visualizing Data
What is Databricks
Databricks Company
Founded by the original creators of Spark
Offers a web-based platform for working with Spark
Provides automatic cluster-management
Offers training sections (free and paid)
What Databricks offer
Access to Spark clusters from your browser
GUI tools to organize and maintain your notebooks and datasets
GUI tools to display and sort your results
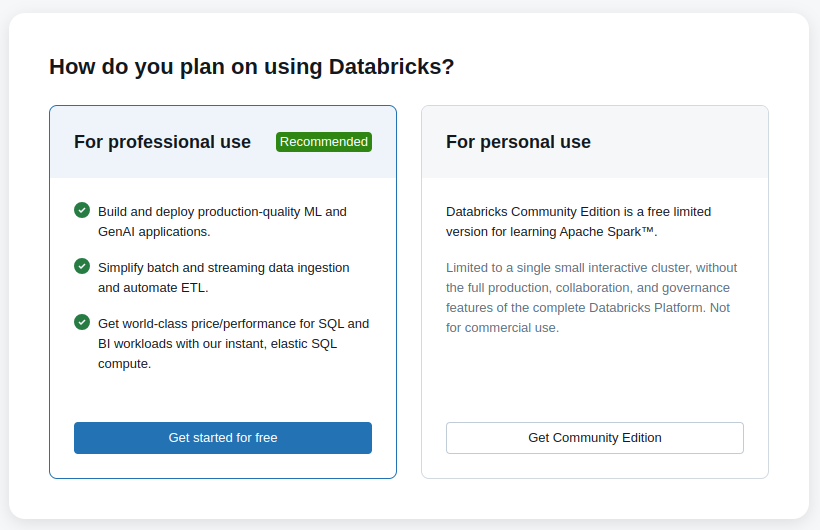
Creating an Account
Sign Up
Databricks has a free community version
This version allows for: 15Gb of data, 6Gb of RAM, two cores, and no worker nodes
Databricks for business runs on either AWS or Azure
Create your account at: databricks.com (Try Databricks)
Sign Up
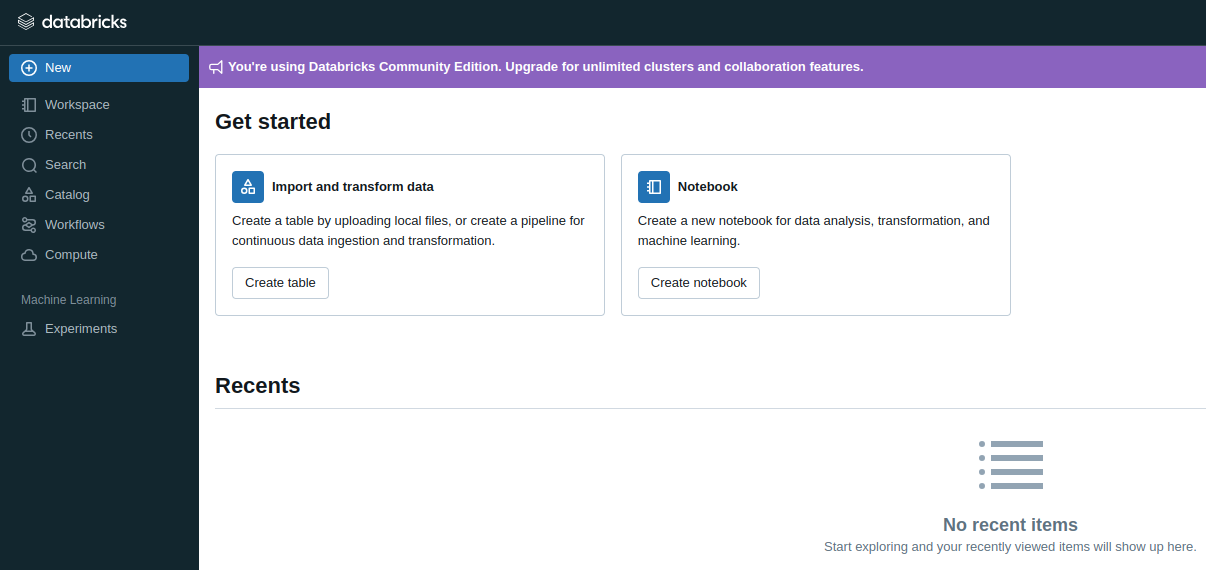
User Interface
User Interface
You can access Databricks UI to:
→ Create new clusters (Compute)
→ Create new notebooks and run code
→ Set up workflows
→ Import data
→ Import libraries
User Interface
Computes
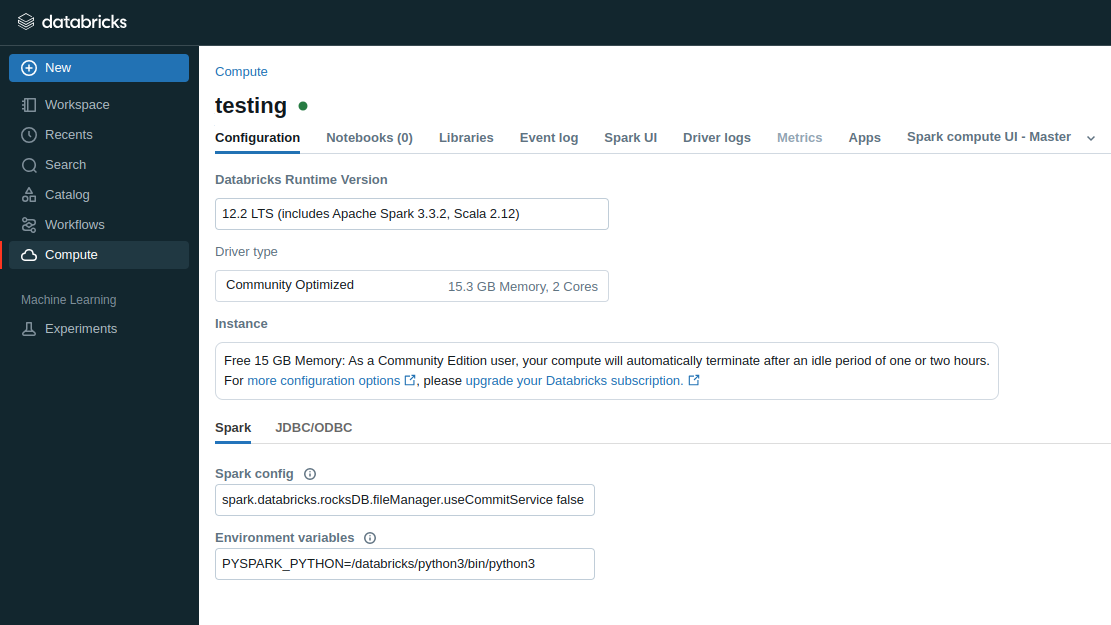
Computes
All processing happens inside computes (formerly known as clusters)
Before running commands, you need to create a new compute
Use its LTS version (12.2 - Spark 3.3.2, Scala 2.12)
It might takes a few minutes for the it to start
Compute
Notebooks
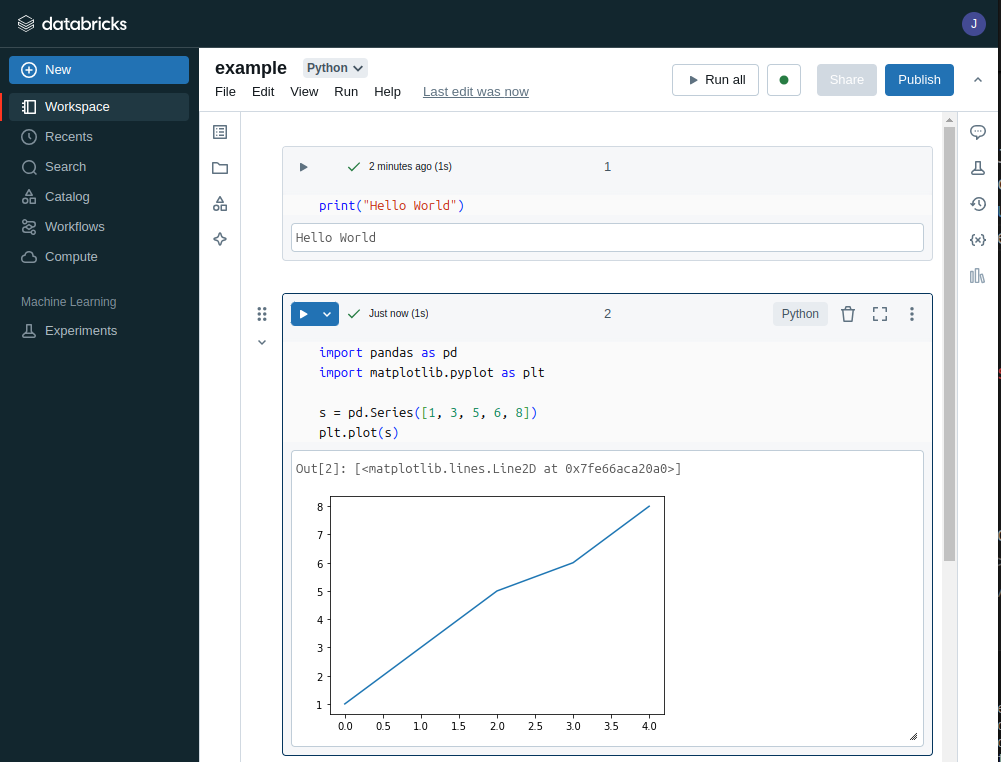
Notebooks
Notebooks are simply Jupyter Notebooks
Each cell can execute a sequence of Python commands
Switch languages with: %md and %sql
To run, a notebook needs to be attached to a compute
You can access notebooks via Workspace
Notebook
Notebooks
You can import notebooks from your computer
Click on New, then on Notebook
Then, from the untitled notebook, click on import and select your file
You can organize your notebooks in folders
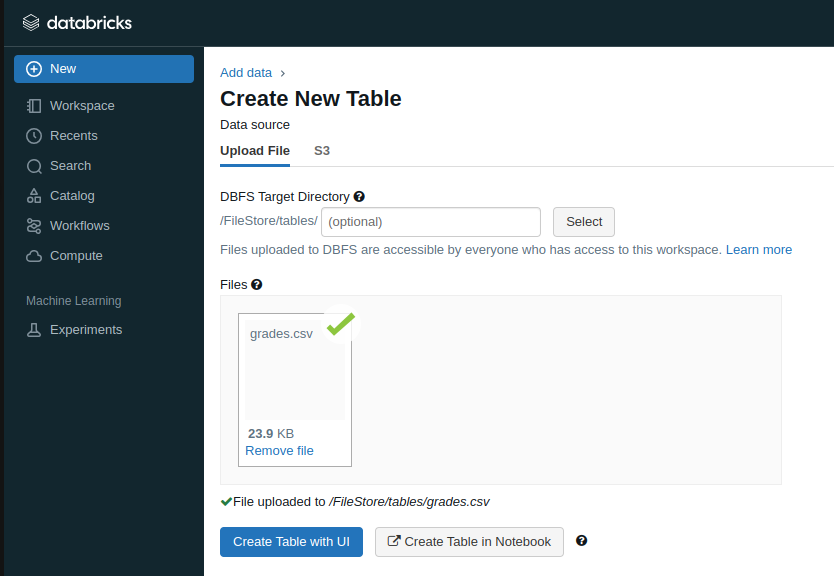
Importing Data
Importing Data
Databricks has a tool to import data from a local machine to its FileSystem - DBFS
Click on New and select Table
Then, drag and drop or browse the data file
Importing Data
Delete a file with:
dbutils.fs.rm("FILE_PATH", True)
Importing Data
After uploaded, the file is stored at the path: /FileStore/tables/FILENAME
Once in the DBFS, the file can be loaded as a DataFrame with:
df = spark.read.csv(FILE_PATH)
Creating Tables
Creating Tables
After importing, datasets can be saved as a table
Tables can be loaded as a DataFrame with:
df = spark.table("TABLE_NAME")
Tables reside in memory (require an active cluster)
We will not use tables in this course
Visualizing Data
Visualizing Data
The method .show() displays the first 20 rows of the DataFrame
A number can be provided to change the number of rows to be shown
The methods head() and tail() exist. But, their output is far from pretty
Visualizing Data
Databricks introduces a display method
Allows for quick visualization of DataFrames
Provides a GUI for plotting
Provides a GUI for downloading CSV
Importing Libraries
Importing Libraries
You can download external python libraries
These add new capabilities to standard Python
Click on Compute, select the desired compute, click on Libraries, and then Install new
Libraries can be fetched from PyPi, Maven, CRAN, or from a file
Reading Material
What is Databricks (video)
Notebook Basics (video)